

Do you ever wonder what happens with the massive amounts of data that is created when users surf the web? As it turns out, companies collect this information and use it for many business-related purposes. So how does it all work? Here’s a beginner’s explanation of one of the most widely used data analysis services: Google Analytics.
A Beginner’s Guide to Google Analytics
Google Analytics is a digital data-collection platform used by businesses that tracks and reports on website traffic. It tracks user interaction throughout the stages of the “purchase funnel”- the process users go through to purchase products/services online.
It does so by collecting data from mobile apps, point-of-sale systems, and video game consoles, and CRM systems. This is made possible through the use of a piece of Javascript tracking code. The code collects sales data, interaction behavior, language, browser and operating system information, and the source of the traffic itself.
Businesses use all of this data to help monitor user interactions with their web content. As a result, they can strategically craft their marketing efforts to boost sales and find new markets.
The data is preserved by using filters to block collection of data from in-office IP addresses. This ensures that the information collected isn’t unintentionally skewed by team members.
When navigating Google Analytics’ interface, it’s important to be familiar with some of the tools that provide insights behind groupings of data. First off, it is crucial to understand how this data is managed within the program.
With Google Analytics, all of the data for a company can be categorized under:
- Organization
- Account
- Property
- View
Organizations are the largest version of collected data, and editing access to an Organization provides the same level of access to the Account, Property, and Views within it.
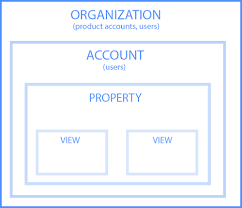
Likewise, if you only have view or property-level access, you cannot make changes to higher ranking datasets in that organization.
Listed to the right is a diagram to help demonstrate this concept.
Now that you have a better understanding of the structure of Google Analytics’ interface, here are some terms to know when navigating the program:
Audience Reports
Audience Reports provide insights into the characteristics of users by measuring site reach by day, week, etc. Using the Javascript code, Google is able to track demographic information (age, gender, location, and interests) in order to help you better understand the users viewing your content.
Acquisition Reports
Acquisition Reports show which channels, or advertisement methods, actually brought users to a website. This could come in the form of Organic ads (unpaid), cost-per-click paid search campaigns (CPCs), Referrals (clicks from sites other than search engines), and emails.
Bounce Rates
Bounce Rates are the percentage of users that leave a site without browsing beyond the landing page. A high bounce rate would suggest that the landing page content is not relevant to its readers.
Behavior Reports
Behavior Reports show how people engaged with a site, including which pages they viewed, landing & exit page interactions, site searches, etc. This allows you to measure content performance on each page, including the relevance of the content on your landing page. This is done by monitoring bounce rates.
Conversation Reports track website goals based on business objectives and can be customized to fit the personalized objectives of each business using the software.
A Segment is a filter you can apply to look at specific data and compare metrics. When monitoring segments it is important to understand that Pageviews are considered the total number of times that pages with your Javascript tracking code were displayed to users.
Dimensions are various attributes of a data set, for example, different styles of t-shirts being sold by a merchandise website. In addition, Metrics are specific values within a data set. In this case, metrics could be considered the number/amount of each t-shirt that is sold from that merchandise website.
When measuring the success of an organization’s marketing campaigns, Campaign Tracking can be used to monitor the progress within a specific channel or method. This is made possible by embedding tracking capabilities within URLs to link them to site products. In doing so, companies can track which campaign caused that product traffic by monitoring the following:
-
-
- Medium (the mechanism used)
- Source (where the user is coming from)
- Marketing campaign
- Content (the version of advertisements)
-
These concepts should help provide a basic understanding of how Google Analytics works. As a result, we hope you see how the insights it provides are extremely relevant to the growth of businesses large and small!
For more information, or to access Google’s beginner course on Analytics, visit the Google Analytics Academy.